Using filter views in Google sheets
Please read this then do it!

This is the latest in a short series of articles with tips for adding new records to the Hydroclimate2k database, and adding interpretation (and other) metadata to those records. Some are more conceptual, others, like this one, are purely techincal.
So without further ago: our metadata entry tool is the QC sheet. As database collation progresses, there will be times when several people are working in the sheet at once. Remember, this single sheet is shared by the entire project.
When entering metadata for a variable, it is often easiest to filter the sheet so it only shows the variable or dataset you are working on. But if you filter the raw sheet, that filtering affects what everyone sees. Which causes difficulties.
To avoid this, when working in the QC sheet, please use filter views. Filter views allow you to filter the sheet without affecting how others see the sheet.
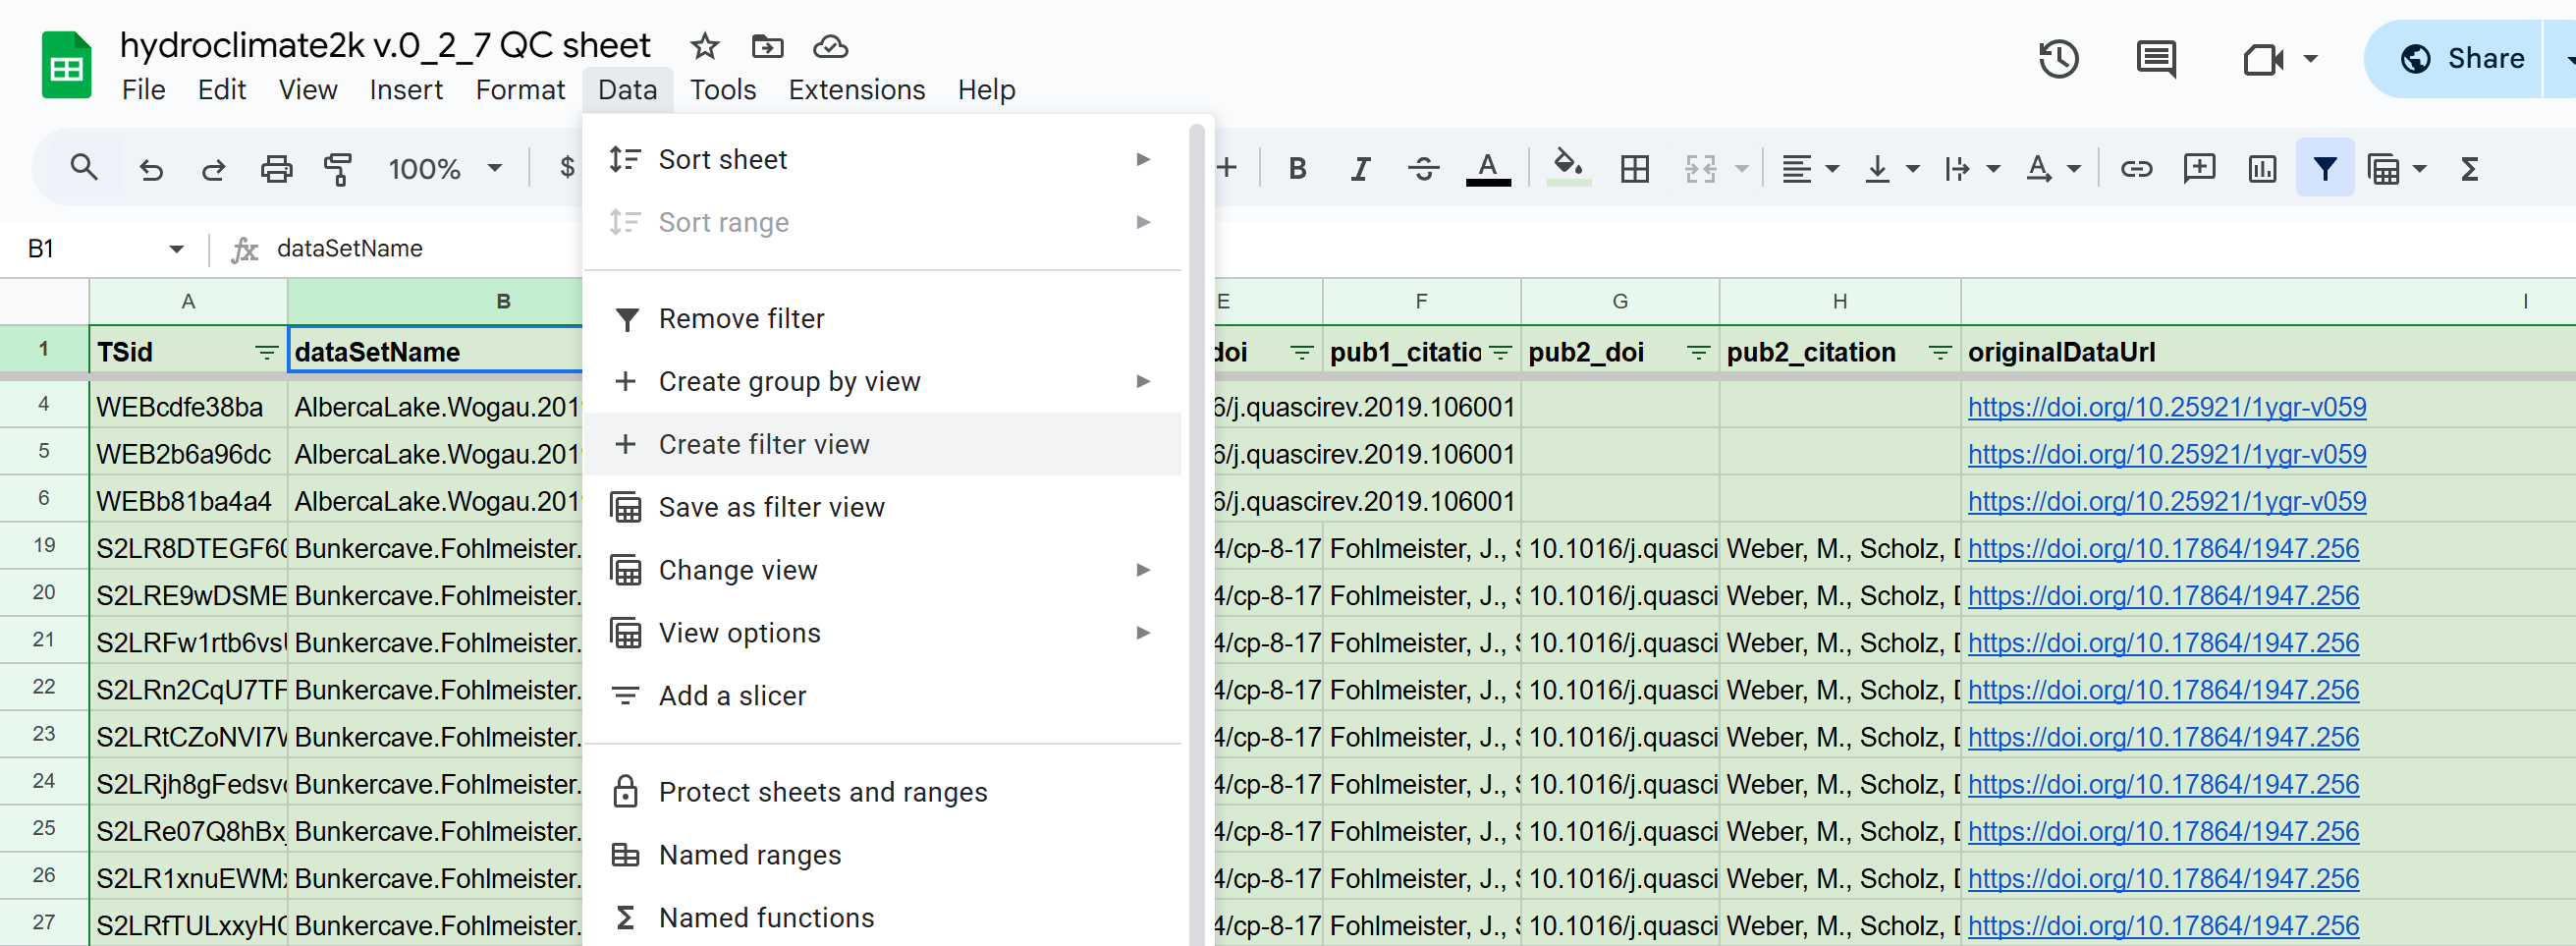
To make a filter view: in the QC sheet go to Data → Create filter view.
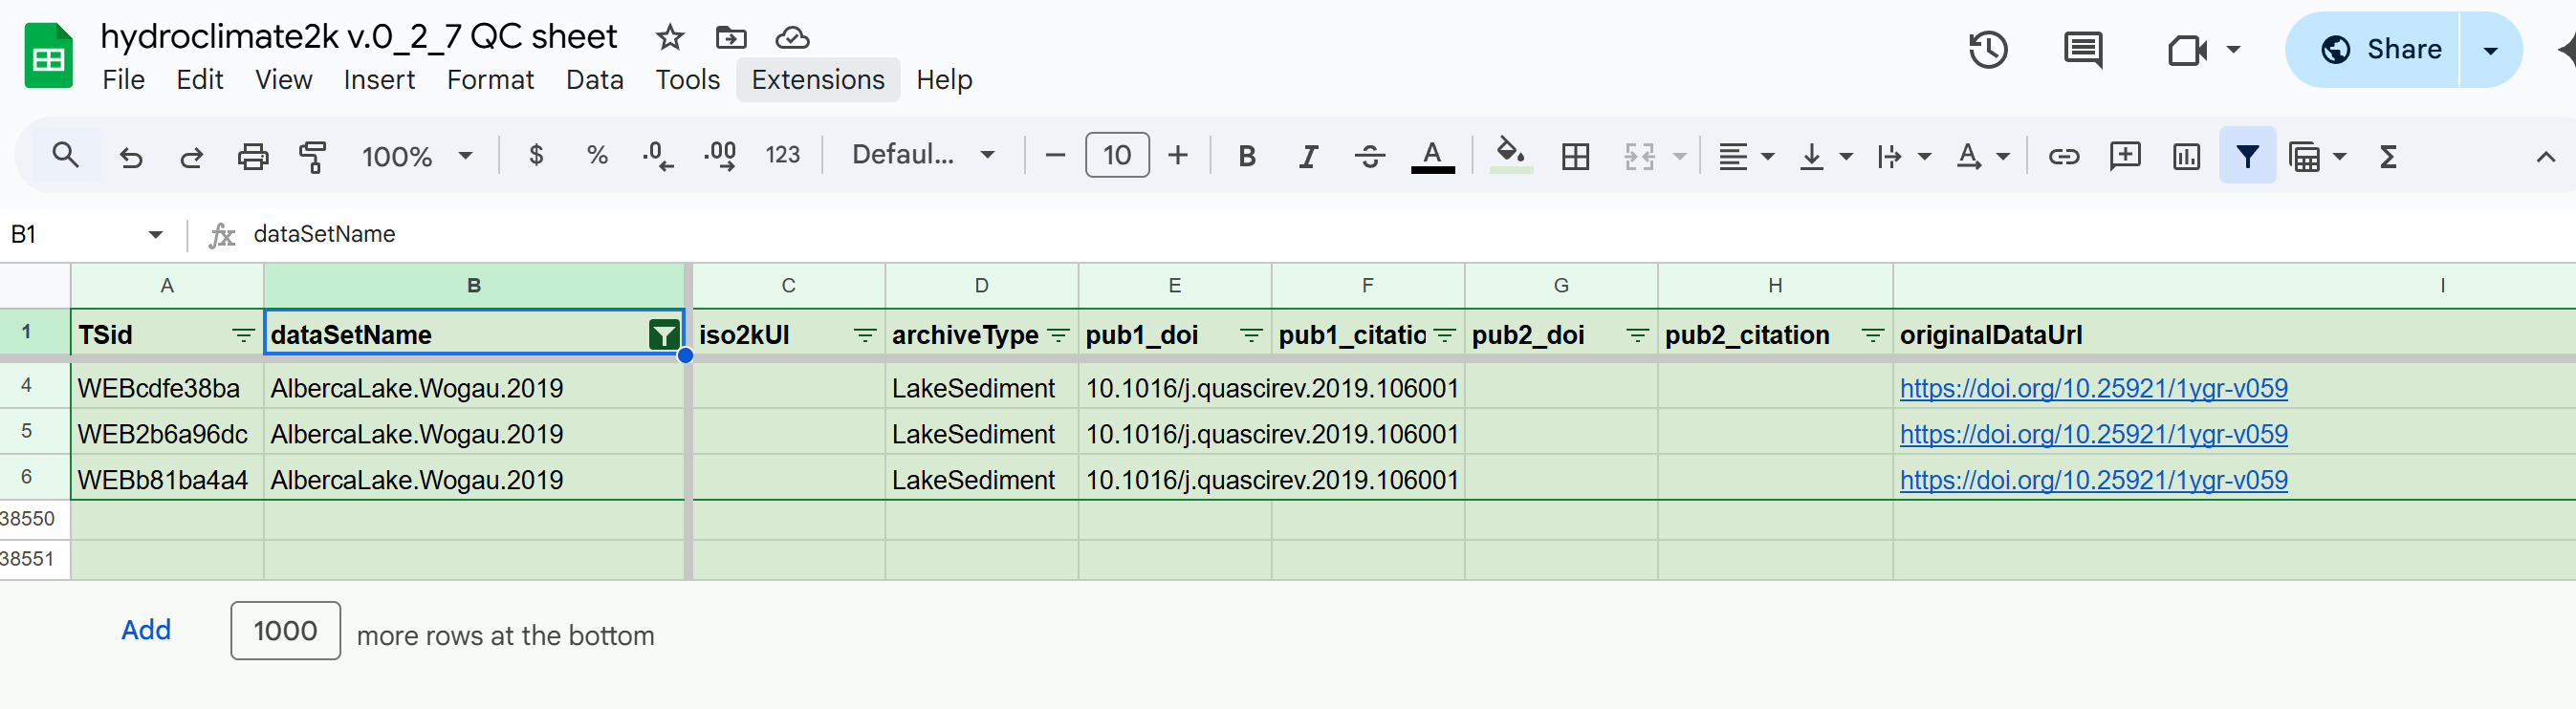
The sheet will now look like this (note the extra bar across the top, just above the column names), and you can safely filter away without affecting how other people see the sheet.
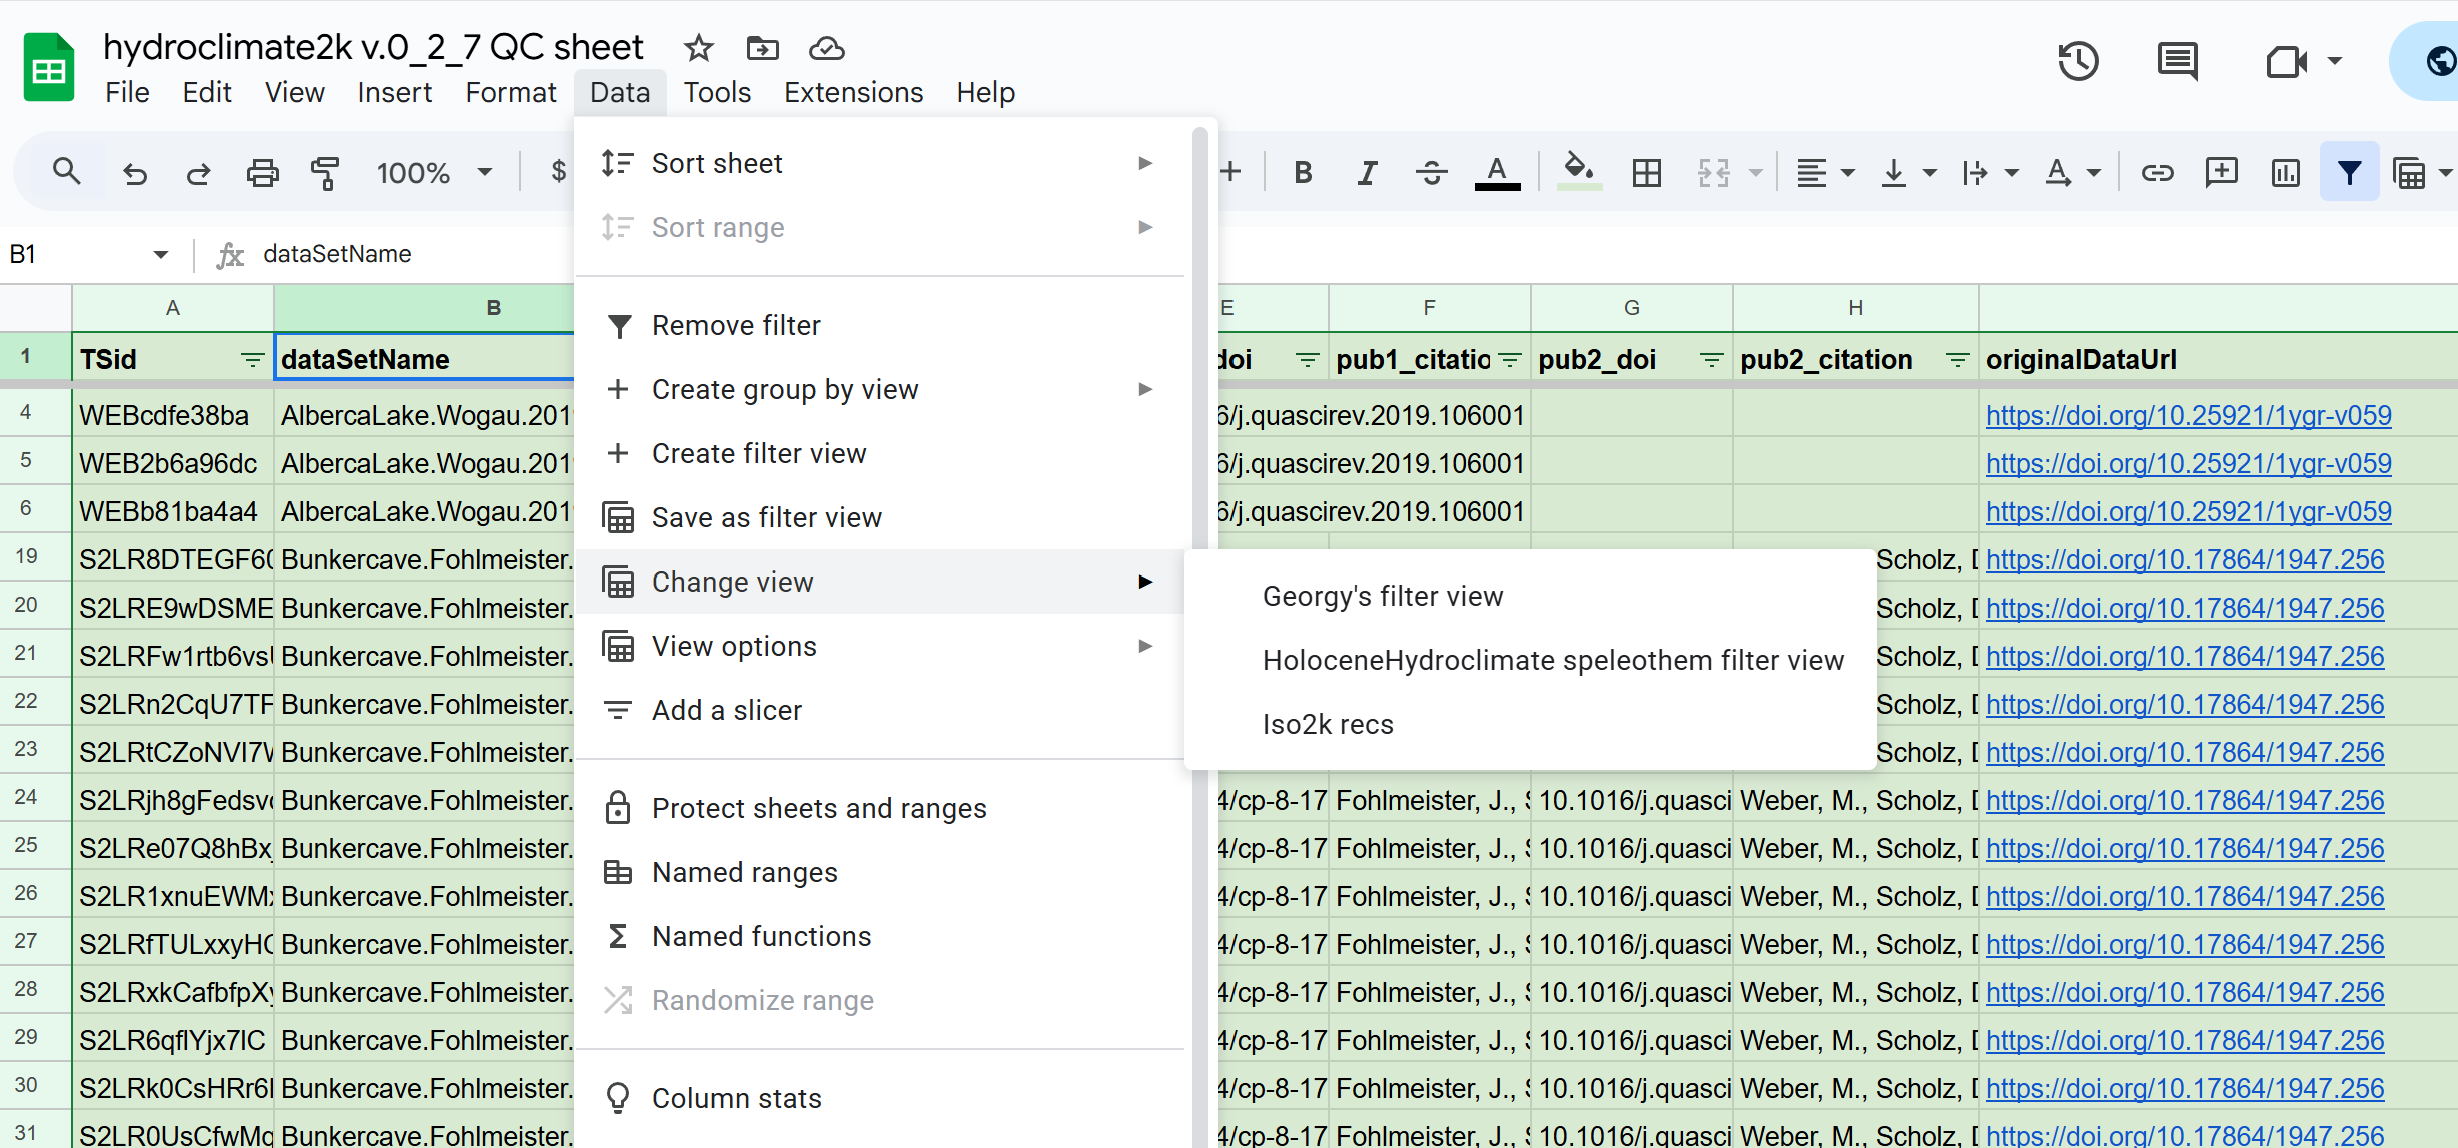
When you are done, simply exit the filter view via Data → Change view → Exit view.
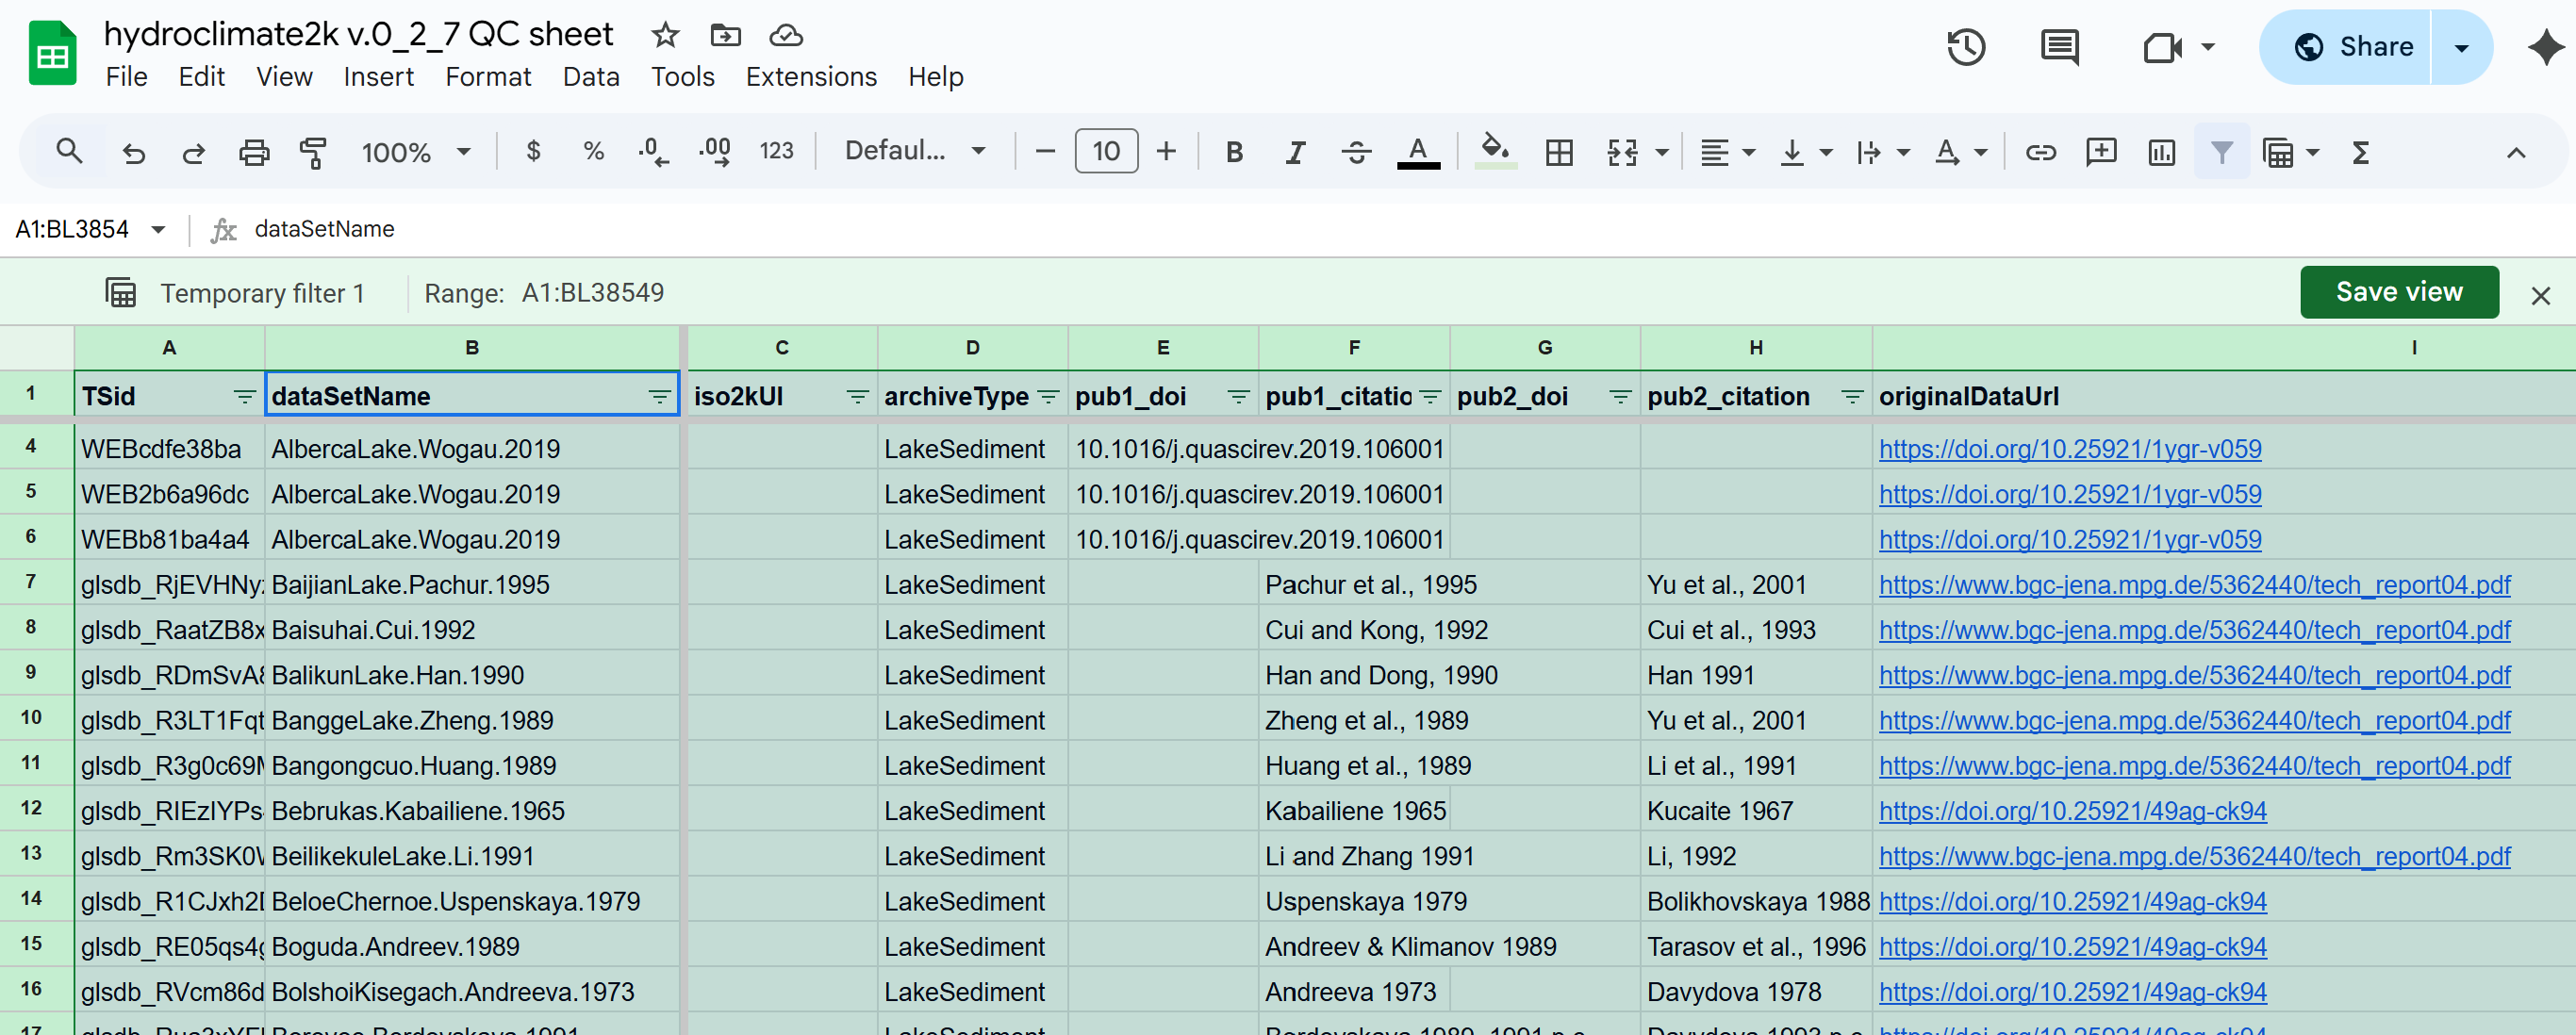
At this point Google sheets will ask you if you want to save the filter view. This probably isn’t necessary in most cases, but there might be some situations where this is useful - for example if you want to share that view with someone else or you did some really complicated filtering that you want to come back to later. In that case, when prompted, give your filter view a sensible name and save it.
You can later go back to a saved view via Data → Change view then choose the view you made.